In part one, we covered programmatically setting up a CTF infrastructure using Terraform and Proxmox. In part two we added a set of vulnerable virtual machines to the system.
In this part, we’re looking at adding security monitoring to the lab environment. We will be using Wazuh, an open source XDR and SIEM system.
Host Setup
As before, we will be using Terraform to setup a host in the Proxmox environment. The following Terraform host will be used to run Wazuh.
resource "proxmox_vm_qemu" "secmon" {
  name        = "SECMON"
  pool        = "CTF"
  desc        = "BORDERGATE CTF - SECMON"
  target_node = "pve"
  clone       = "ubuntu-24.04-cloud-init-template"
  agent       = 1
  os_type     = "cloud-init"
  cores       = 4
  memory      = 8192
  scsihw      = "virtio-scsi-pci"
  vmid        = 600
  onboot      = true
  ciuser      = "bordergate"
  cipassword  = "Password1"
  boot        = "order=scsi0"

  disks {
    ide {
      ide3 {
        cloudinit {
          storage = "local-lvm"
        }
      }
    }

    scsi {
      scsi0 {
        disk {
          size    = 50
          cache   = "writeback"
          storage = "local-lvm"
          discard = true
        }
      }
    }
  }

  network {
    model  = "virtio"
    bridge = "vmbr0"
  }

  network {
    model  = "virtio"
    bridge = "vmbr1"
  }

  network {
    model  = "virtio"
    bridge = "vmbr2"
  }

  network {
    model  = "virtio"
    bridge = "vmbr3"
  }

  ipconfig0 = "ip=dhcp"
  ipconfig1 = "ip=192.168.24.251/24"
  ipconfig2 = "ip=172.16.24.251/24"
  ipconfig3 = "ip=10.0.24.251/24"
}
As before, the host can now be created using the apply command.
terraform apply
Wazuh Configuration
Run the installer with the following command.
bordergate@SECMON:~$ curl -sO https://packages.wazuh.com/4.12/wazuh-install.sh && sudo bash ./wazuh-install.sh -a
If you have a lower amount of resources on the VM (such as the 8GB of RAM we allocated) this may stall at points.
The installer should provide a set of randomly generated administrator credentials when it completes.
26/08/2025 08:40:49 INFO: You can access the web interface https://<wazuh-dashboard-ip>:443
    User: admin
    Password: HqaT9y2HZD.R.SMTpGEQvefc+ntkCDO6
26/08/2025 08:40:49 INFO: Installation finished.
To deploy the monitoring agents we will be using Ansible. On our director system that we have been using to run Ansible scripts, clone the Wazuh Ansible repository.
sudo git clone --branch v4.12.0 https://github.com/wazuh/wazuh-ansible.git
We will need to use three separate Ansible configurations to ensure the Wazuh agents can communicate with the IP address of the Wazuh server that sits on their subnet.
# WAZUH-AGENT-L1.yaml
- name: Install Wazuh agent on Linux hosts
  hosts: N1-ZEUS,N1-HERA,N1-AEOLUS
  become: yes
  become_user: root
  roles:
    - /home/bordergate/wazuh-ansible/roles/wazuh/ansible-wazuh-agent
  vars:
    wazuh_managers:
      - address: 192.168.24.251
        port: 1514
        protocol: tcp
        api_port: 55000
        api_proto: 'https'
        api_user: wazuh
        max_retries: 5
        retry_interval: 5

- name: Install Wazuh agent on Windows hosts
  hosts: N1-ARES
  roles:
    - /home/bordergate/wazuh-ansible/roles/wazuh/ansible-wazuh-agent
  vars:
    wazuh_managers:
      - address: 192.168.24.251
        port: 1514
        protocol: tcp
        api_port: 55000
        api_proto: 'https'
        api_user: wazuh
        max_retries: 5
        retry_interval: 5
# WAZUH-AGENT-L2.yaml
- name: Install Wazuh agent on Linux hosts
  hosts: N2-HERMES,N2-HADES
  become: yes
  become_user: root
  roles:
    - /home/bordergate/wazuh-ansible/roles/wazuh/ansible-wazuh-agent
  vars:
    wazuh_managers:
      - address: 172.16.24.251
        port: 1514
        protocol: tcp
        api_port: 55000
        api_proto: 'https'
        api_user: wazuh
        max_retries: 5
        retry_interval: 5

- name: Install Wazuh agent on Windows hosts
  hosts: N2-APOLLO,N2-DEMETER
  roles:
    - /home/bordergate/wazuh-ansible/roles/wazuh/ansible-wazuh-agent
  vars:
    wazuh_managers:
      - address: 172.16.24.251
        port: 1514
        protocol: tcp
        api_port: 55000
        api_proto: 'https'
        api_user: wazuh
        max_retries: 5
        retry_interval: 5
# WAZUH-AGENT-L3.yaml
- name: Install Wazuh agent on Linux hosts
  hosts: N3-PROMETHEUS
  become: yes
  become_user: root
  roles:
    - /home/bordergate/wazuh-ansible/roles/wazuh/ansible-wazuh-agent
  vars:
    wazuh_managers:
      - address: 10.0.24.251
        port: 1514
        protocol: tcp
        api_port: 55000
        api_proto: 'https'
        api_user: wazuh
        max_retries: 5
        retry_interval: 5

- name: Install Wazuh agent on Windows hosts
  hosts: N3-ARTEMIS
  roles:
    - /home/bordergate/wazuh-ansible/roles/wazuh/ansible-wazuh-agent
  vars:
    wazuh_managers:
      - address: 10.0.24.251
        port: 1514
        protocol: tcp
        api_port: 55000
        api_proto: 'https'
        api_user: wazuh
        max_retries: 5
        retry_interval: 5
Deploy the agents by running the playbooks.
export ANSIBLE_HOST_KEY_CHECKING=False
ansible-playbook -i ../inventory.py WAZUH-AGENT-L1.yaml
ansible-playbook -i ../inventory.py WAZUH-AGENT-L2.yaml
ansible-playbook -i ../inventory.py WAZUH-AGENT-L3.yaml
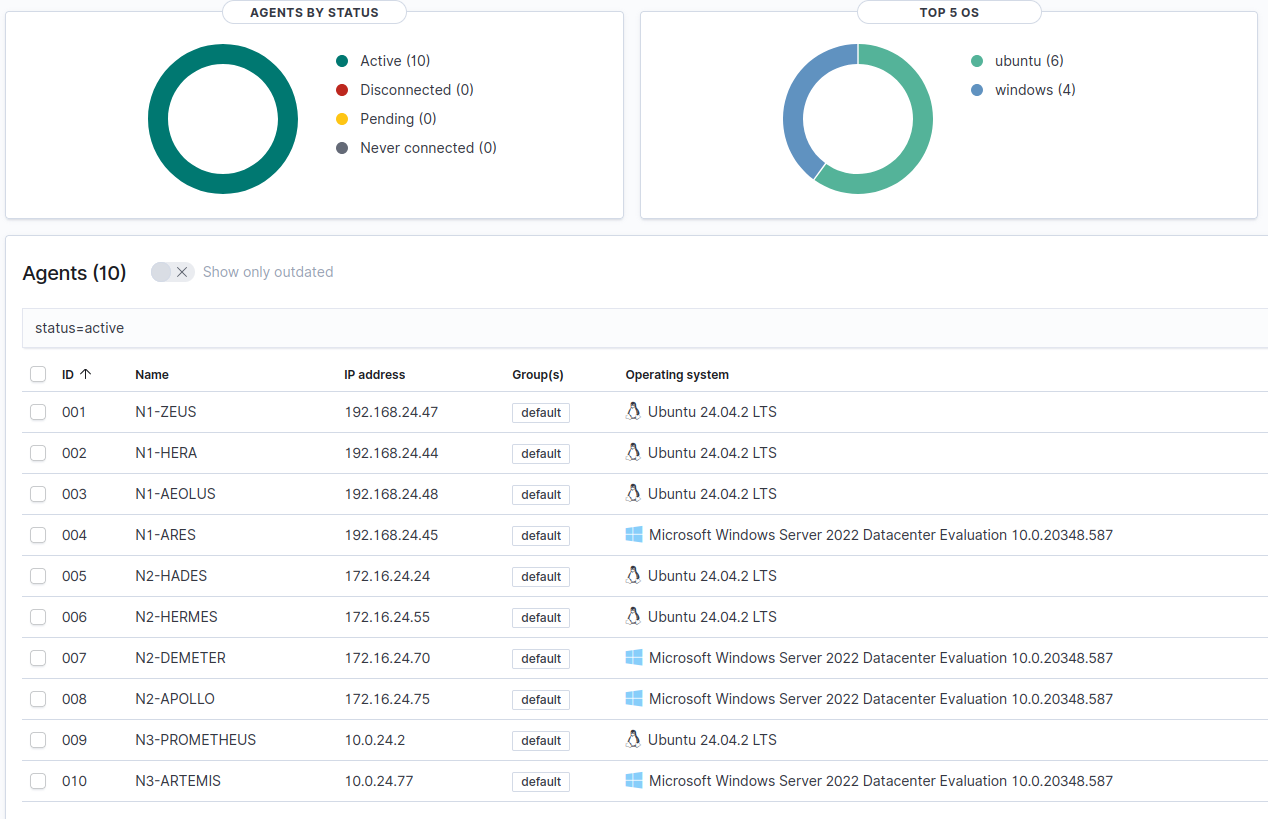
With the agents installed, you should see all the systems as showing as active on the Wazuh web interface.
Suricata Configuration
For network based intrusion detection, we will be using Suricata with the emerging threats ruleset. Install Suricata with the following commands.
sudo add-apt-repository ppa:oisf/suricata-stable
sudo apt-get update
sudo apt-get install suricata -y
Download the emerging threats ruleset and copy it to the rules directory.
cd /tmp/
wget https://rules.emergingthreats.net/open/suricata-7.0.3/emerging.rules.tar.gz
sudo tar -xvzf emerging.rules.tar.gz
sudo mkdir /var/lib/suricata/rules
sudo cp -R rules/* /var/lib/suricata/rules
Modify the configuration file to ensure we are capturing traffic on all interfaces.
sudo vim /etc/suricata/suricata.yaml
af-packet:
  - interface: eth0
  - interface: eth1
  - interface: eth2
  - interface: eth3
  address-groups:
    HOME_NET: "[192.168.0.0/16,172.16.24.0/24,10.0.24.0/24]"
    EXTERNAL_NET: "any"

default-rule-path: /var/lib/suricata/rules
rule-files:
  - "*.rules"
Restart Suricata.
sudo systemctl restart suricata
Next, modify /var/ossec/etc/ossec.conf to ensure a localfile directive is in place so OSSEC agent reads the log.
  <localfile>
    <log_format>json</log_format>
    <location>/var/log/suricata/eve.json</location>
  </localfile>
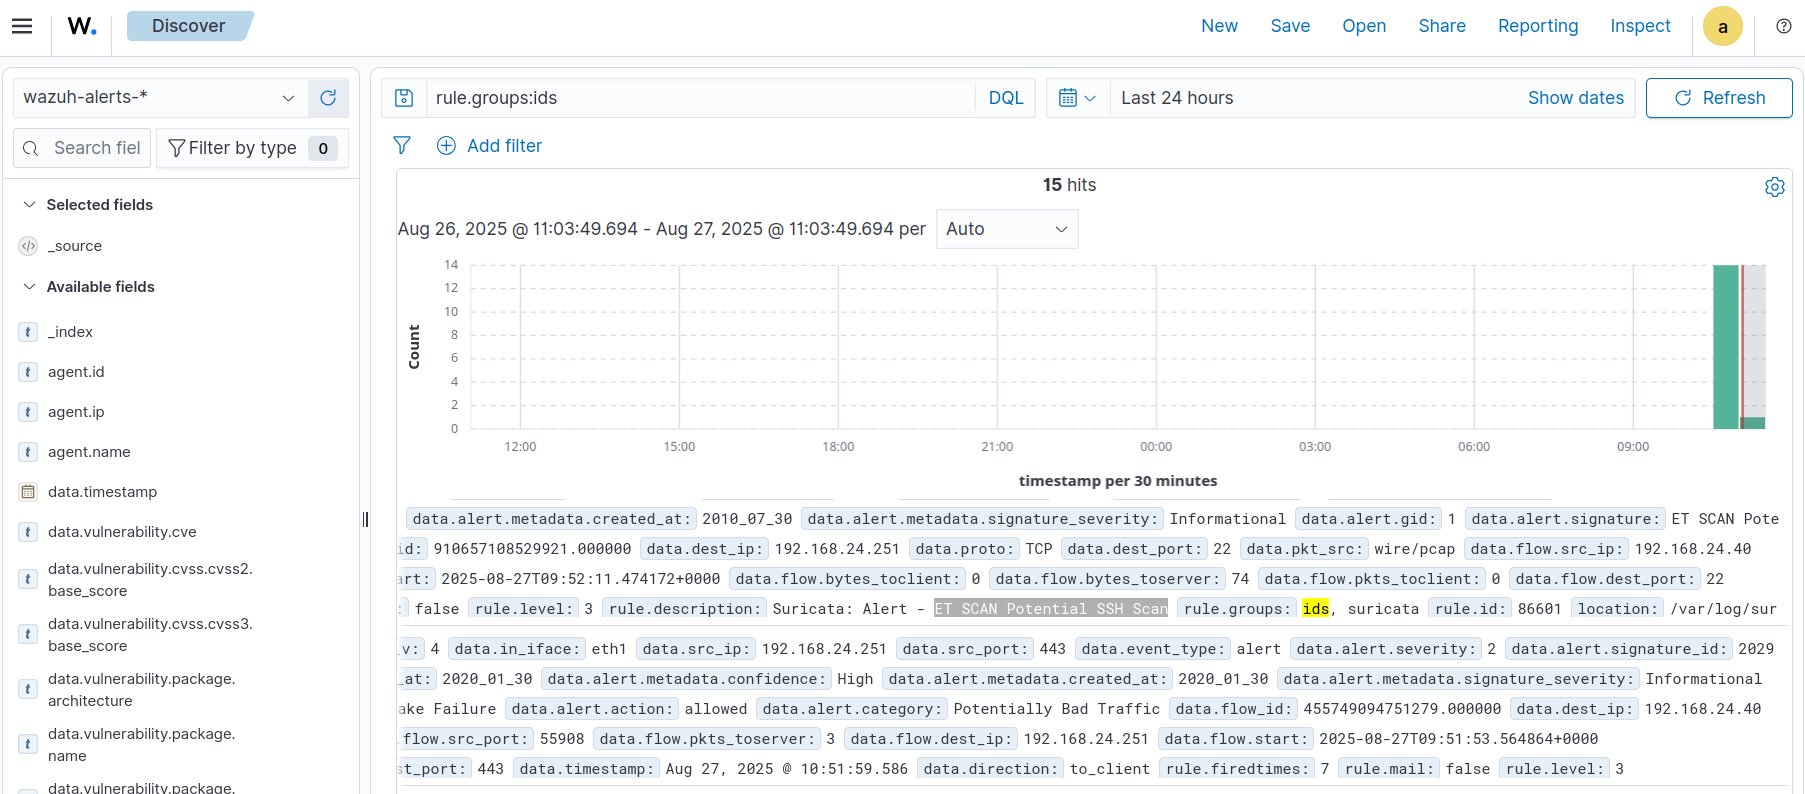
On the Wazuh web interface, you should see IDS events under the Discover tab, by looking for the rule group “ids”.
Suricata will capture traffic going to the Wazuh system, but won’t be able to monitor other hosts on the subnets without being on a SPAN port. Unfortunately, configuring monitoring interfaces on Proxmox isn’t trivial and normally requires using Open vSwitch.
In Conclusion
Having network monitoring on a CTF can be useful to understand the log entries being left behind when conducting attacks, and determining the routes that players have taken.